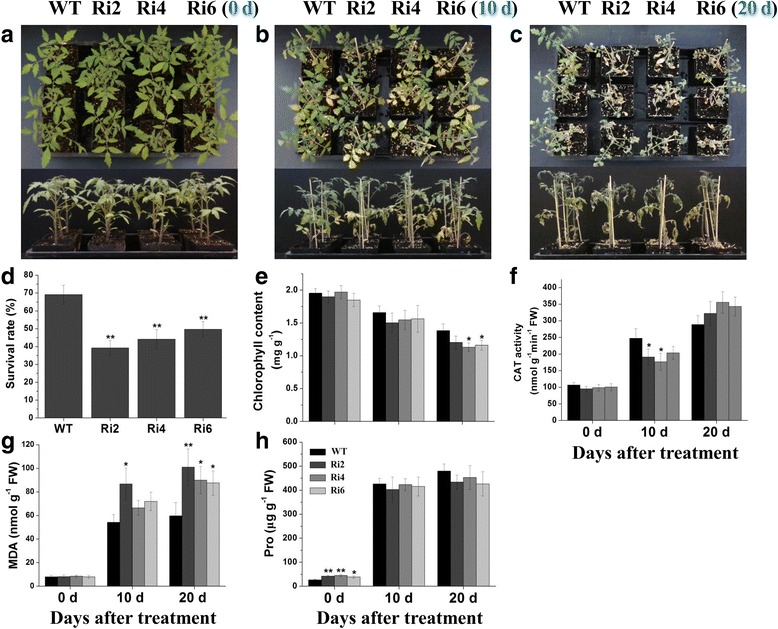
Fig. 5.

Drought tolerance testing of SlbZIP1-RNAi plants. 8-week-old WT and transgenic plants were incubated with 20% PEG6000 for up to 20 d. Representative phenotypes of WT and SlbZIP1-RNAi plants at 0 (a), 10 (b) and 20 d (c) after initiation of drought assay. d Survival rates of WT and transgenic plants after rewatering for 5 d following 20 d of PEG assay. Bars represent the mean of three biological replicates of 20 plants each. e-h Comparisons of chlorophyll content (e), CAT activity (f), MDA content (g), and Pro content (h) between WT and transgenic plants at 0, 10 and 20 d after drought stress. Bars represent the mean of three biological replicates ± SE. Asterisks indicate statistical significance (*0.01 < P < 0.05, **P < 0.01) between WT and transgenic plants, respectively
