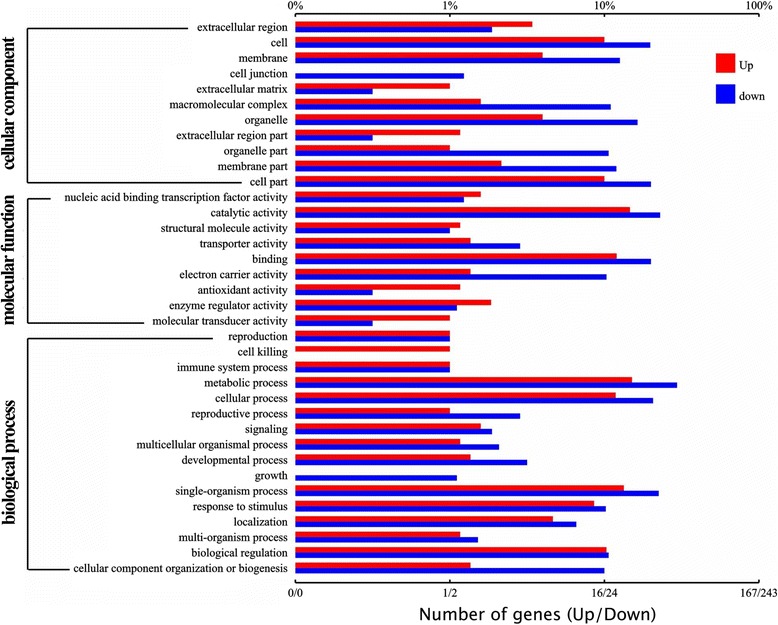
Fig. 6.

Functional analysis of DEGs in WT and SlbZIP1-RNAi plants based on RNA-Seq data. GO functional enrichment analysis of DEGs between WT and SlbZIP1-RNAi plants based on sequence homology. Top X axis and Bottom X axis represents to the numbers of upregulated or downregulated genes annotated by GO term and the percentages of annotated genes accounted for the total annotated genes, respectively. The Y axis refers GO classification including Cellular Component, Molecular Function, and Biological Process. The red bar and blue bar refers up-regulated genes and down regulated genes, respectively
