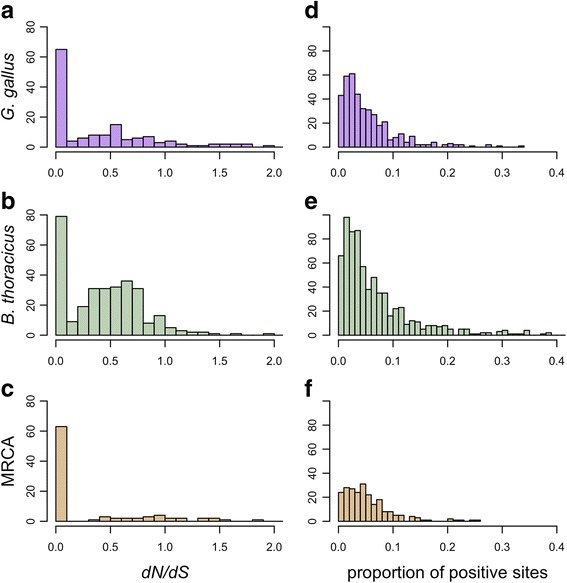
Fig. 3.

Distributions of foreground gene-wide dN/dS and the ML estimates of the proportions of sites under positive selection for significant branch and branch-site tests. Results are after multiple-testing corrections. dN/dS distributions were truncated at two for ease of visualization and because excessively high dN/dS estimates likely are unreliable. Panels a-c correspond to gene-wide dN/dS from branch tests while panels d-f correspond to the proportion of sites under positive selection from branch-site tests
