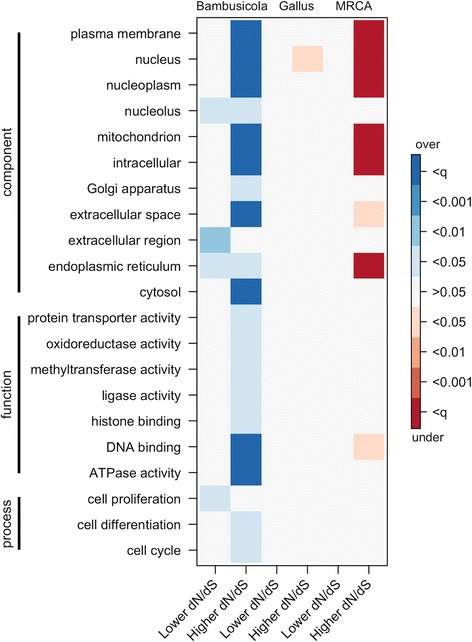
Fig. 5.

Overrepresentation or underrepresentation of GO slim categories. Tests were conducted for a proportion of sites under positive selection, lower gene-wide dN/dS, and higher gene-wide dN/dS, on the Bambusicola, Gallus, and MRCA branches. Overrepresented terms are blue, and underrepresented terms are red. Levels of significance are shown for p < 0.05, p < 0.01, p < 0.001, and p < q, where q is the Benjamini-Hochberg q-value corrected for a FDR of 0.05
