Fig. 3.

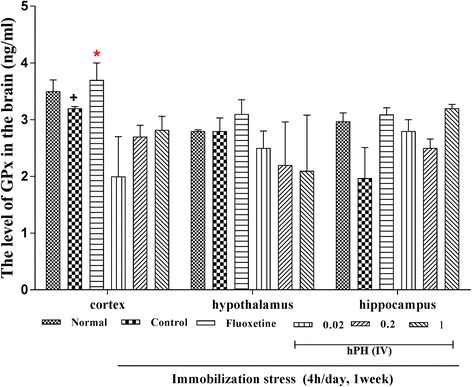
The effects of hPH treatment on the level of GPx in the brain. Each value represents the mean + S.E.M. +P < 0.05 compared to the normal group; *P < 0.05 compared to the control group

The effects of hPH treatment on the level of GPx in the brain. Each value represents the mean + S.E.M. +P < 0.05 compared to the normal group; *P < 0.05 compared to the control group