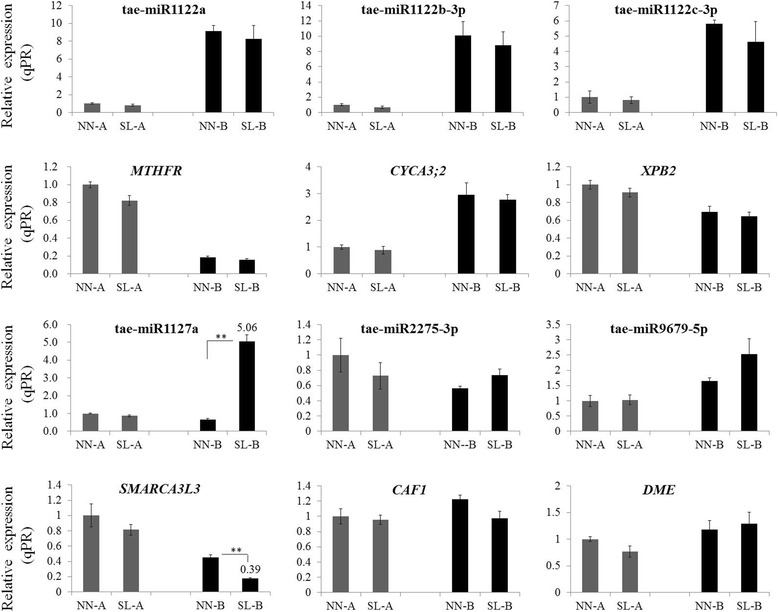
Fig. 8.

The expression profiles of miRNAs and their targets. Expression changes of miRNA and their target genes at early anther development stages. Samples were collected from normal day-length/normal temperature (NN-A/NN-B) and short day-length/low temperature (SL-A/SL-B) condition. The transcript level of each gene was normalized to NN-A. The fold change normalized ≥ 2 or ≤ 0.5 were represented by numerical value. Error bars indicated s.d. based on three biological replicates (**P < 0.01, Student’s t-test)
