
Fig. 9.
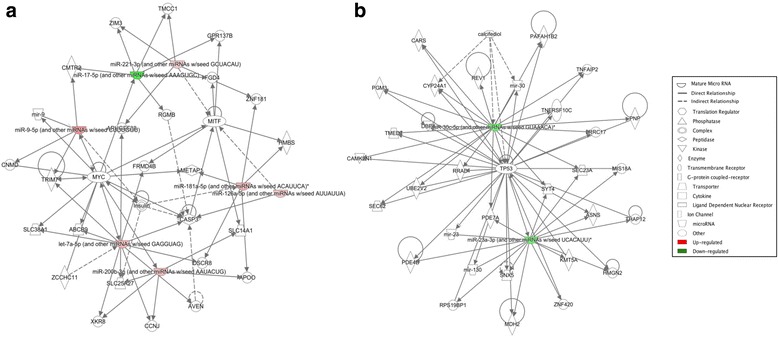
Comparison of networks affected by FA or O3 exposure in females at different stages of the estrous cycle. Diagram of biological networks associated with miRNAs whose expression was up- or downregulated in the lungs of animals exposed to FA vs. O3 in proestrus (a) or non-proestrus stages (b). Both diagrams show reported direct (solid lines) and indirect (dashed lines) interactions. Molecules that are downregulated or upregulated are represented as a node in green or red, respectively. Network analysis was performed with Ingenuity Pathway Analysis