
Fig. 3.
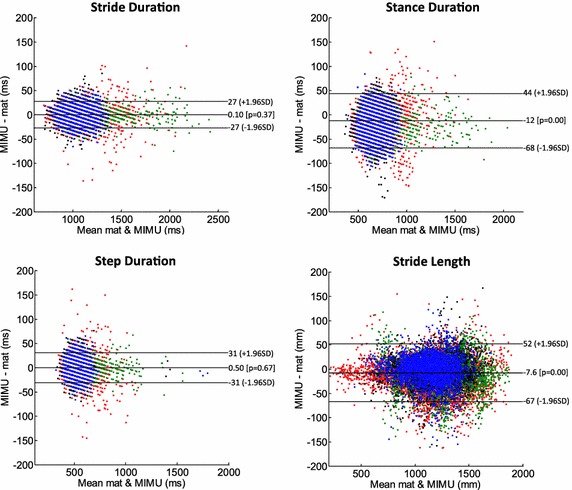
Difference (Bland–Altman) plots for stride, stance and step durations and for stride length. Limits of agreement are, respectively, 27, 56, 31 ms and 60 mm. Red: TASMC; green: KULEU; black: NEWCA; blue: UNIGE
Official websites use .gov
A
.gov website belongs to an official
government organization in the United States.
Secure .gov websites use HTTPS
A lock (
) or https:// means you've safely
connected to the .gov website. Share sensitive
information only on official, secure websites.
Difference (Bland–Altman) plots for stride, stance and step durations and for stride length. Limits of agreement are, respectively, 27, 56, 31 ms and 60 mm. Red: TASMC; green: KULEU; black: NEWCA; blue: UNIGE