
Fig. 2.
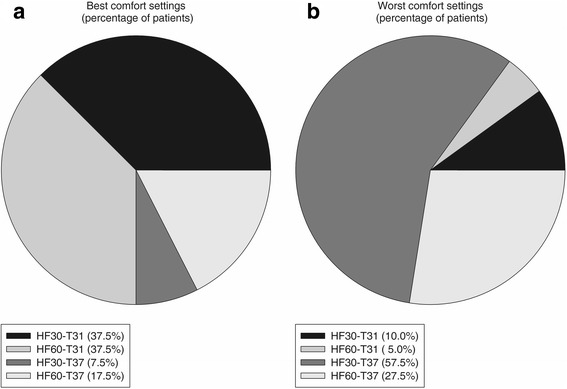
Best and worst comfort. Distribution of “best comfort settings” (a) and “worst comfort settings” (b) expressed as percentage of patients reporting highest or lowest comfort value in that particular study phase (see text for detailed description). HF30-T31 gas flow 30 l/min and temperature 31 °C, HF60-T31 gas flow 60 l/min and temperature 31 °C, HF30-T37 gas flow 30 l/min and temperature 37 °C, HF60-T37 gas flow 60 l/min and temperature 37 °C