Fig. 3.

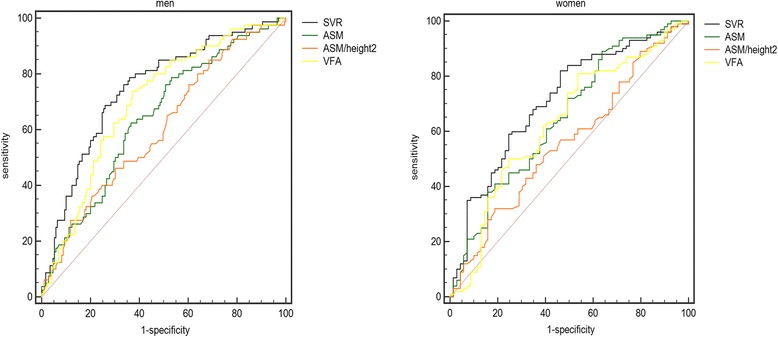
ROC curves of SVR, ASM, ASM/height2 and VFA for high baPWV. SVR had the highest area under the ROC curve, with statistical significance (0.747 in men and 0.710 in women)

ROC curves of SVR, ASM, ASM/height2 and VFA for high baPWV. SVR had the highest area under the ROC curve, with statistical significance (0.747 in men and 0.710 in women)