
Fig. 1.
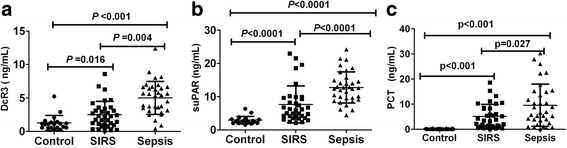
Levels of DcR3, suPAR and PCT a: Minimum-maximum (median) value of serum DcR3 in sepsis (n = 34), SIRS (n = 34) and controls (n = 20) by non-parametric Kruskal–Wallis test (p < 0.001). b: mean ± SD value of serum suPAR in controls (n = 20), SIRS (n = 34) and sepsis (n = 34), respectively, by Mann–Whitney test (p < 0.001). c: Minimum-maximum (median) value of PCT in controls (n = 20), SIRS (n = 34) and sepsis (n = 34), by all non-parametric Kruskal–Wallis test (p < 0.001)