
Fig. 3.
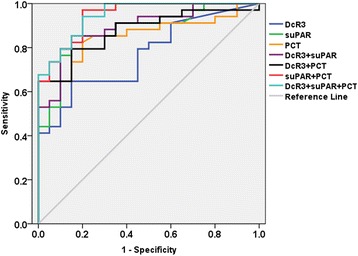
ROC evaluation of DcR3, suPAR, PCT and DcR3 combined with suPAR, PCT in control group vs. SIRS group. The ROC evaluation was performed at cut-off values recommended by the scientific community of laboratory medicine with 95% CI
Official websites use .gov
A
.gov website belongs to an official
government organization in the United States.
Secure .gov websites use HTTPS
A lock (
) or https:// means you've safely
connected to the .gov website. Share sensitive
information only on official, secure websites.
ROC evaluation of DcR3, suPAR, PCT and DcR3 combined with suPAR, PCT in control group vs. SIRS group. The ROC evaluation was performed at cut-off values recommended by the scientific community of laboratory medicine with 95% CI