
Fig. 1.
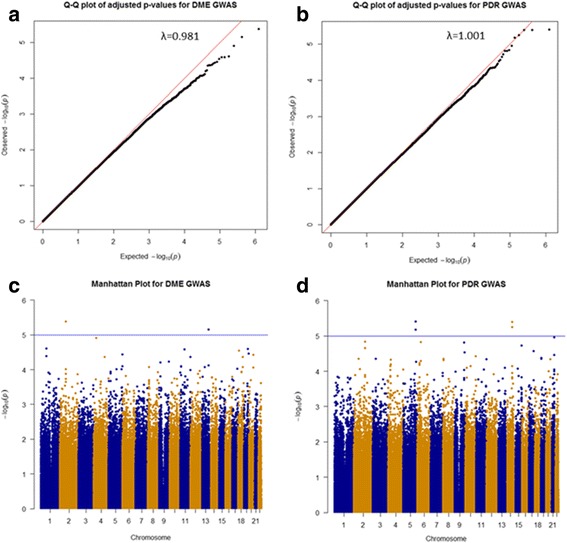
Q-Q plots and Manhattan plots for DME and PDR GWAS. Q-Q plots for (a) Diabetic Macular Edema and (b) Proliferative Diabetic Retinopathy GWAS. Manhattan plots for (c) Diabetic Macular Edema and (d) Proliferative Diabetic Retinopathy GWAS. The blue horizontal line represents suggestive association at p = 1.0 × 10− 5