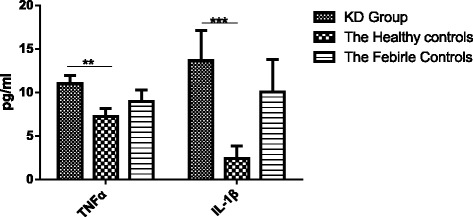
Fig. 1.

Serum levels of cytokines in the acute phase of KD and control subjects. This figure shows that the levels of TNF-α in KD group were obviously higher than that of the healthy group (P < 0.05). Also, IL-1β levels in KD group were significantly increased compared with healthy group (P < 0.05). **Represents a significant difference between groups, which is P < 0.05. ***Represents a significant difference between groups, which is P < 0.01.
