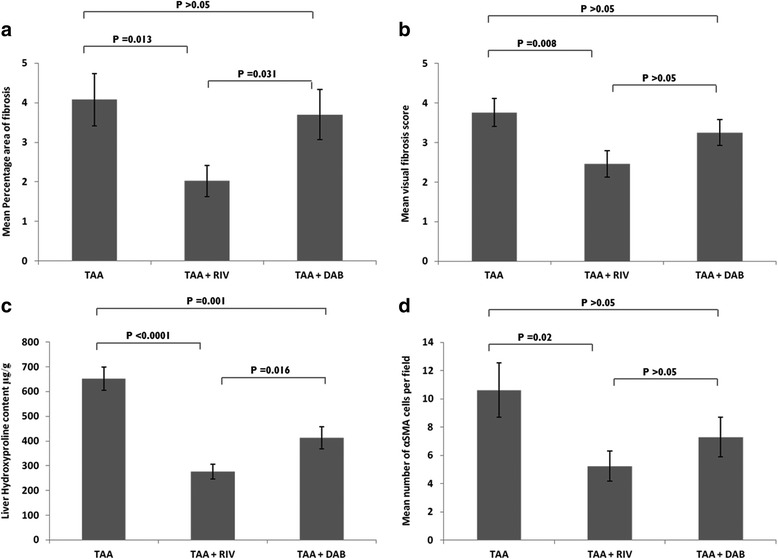
Fig. 4.

Mean percentage area of fibrosis, mean fibrosis visual scores, liver hydroxyproline and αSMA cells following 8 weeks of exposure with TAA. Bar graphs showing (a) mean percentage area of fibrosis. Picro-Sirius red stained histological sections of liver were assessed under light microscopy for fibrosis. The extent of hepatic fibrosis was assessed in field of view (n = 10) under a light microscope, using a semi-quantitative score [17] coupled with digital image analyses (b) and mean visual fibrosis score agreed by two independent histopathologists using standardized protocols (c) liver hydroxyproline content. Frozen liver samples (TAA; n = 13, TAA + RIV; n = 13; TAA + DAB; n = 11) were homogenized in water and hydrolysed in HCl. Hydroxyproline was oxidized and reacted with DMAB to produce colour change which is directly proportional to Hydroxyproline concentration and (d) mean number of αSMA cells following 8 weeks of TAA exposure. Histological sections were stained for αSMA as described under methods and examined under a light microscope. Number of stellate cells stained positive for αSMA were counted per field of vision (n = 6), and an average calculated, which represented the mean number of activated stellate cells. Data are mean +/− SEM unless otherwise stated. Abbreviations: DAB, Dabigatran; RIV, Rivaroxaban; TAA, Thioacetamide; DMAB, 4-(dimethylamino) benzaldehyde. All sections were examined with a light microscope and the number of stellate cells stained positive for αSMA were counted per field of vision at × 20 objective. Six fields per section were randomly chosen, and an average calculated, which represented the mean number of activated stellate cells for each individual mouse per field
