Fig. 3.

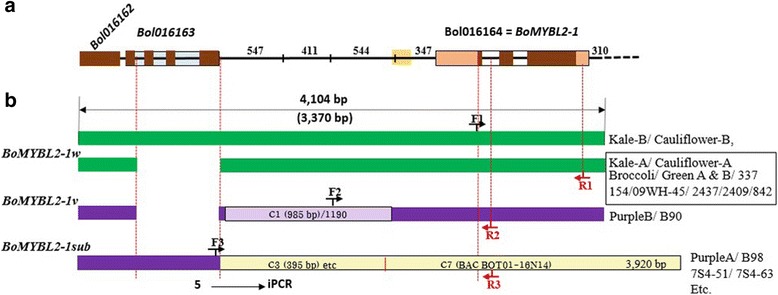
Schematic representation of BoMYML2–1 genomic DNA from various B. oleracea plants showing the positions of the molecular markers. a: Schematic representation of the BoMYBL2–1 genomic sequence based on the BRAD database (http://brassicadb.org/brad; Liu et al. 2014). The yellow block upstream of BoMYBL2–1 represents a 159 bp repeat sequence. b: Schematic representation of BoMYBL2–1 genomic DNA sequences identified in this study. iPCR indicates sequences obtained using inverse-PCR. BoMYBL2–1w, BoMYBL2–1v, and BoMYBL2–1sub represent the wild-type version, the BoMYBL2–1 variant, and the BoMYBL2–1 substitution, respectively. F1, F2, F3: forward primers 1, 2, 3; R1, R2, R3: reverse primers (see Table 2)
