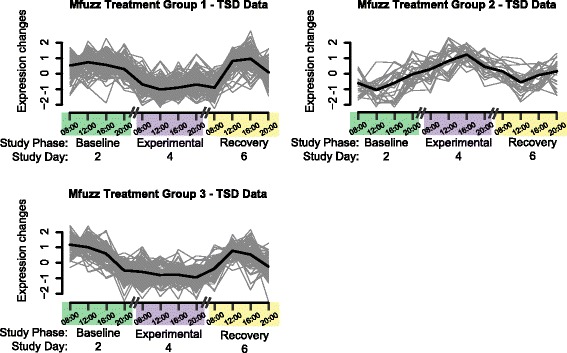
Fig. 4.

Temporal expression of microarray Transcript Clusters that are significant for the Treatment effect. Gray lines represent individual Transcript Clusters, and the thick black line represents the group center. Values represent normalized expression based on data from Total Sleep Deprivation (TSD) subjects during three of the seven consecutive study days, consisting of 1 day each during the Baseline, Experimental, and Recovery phases
