Fig. 3.

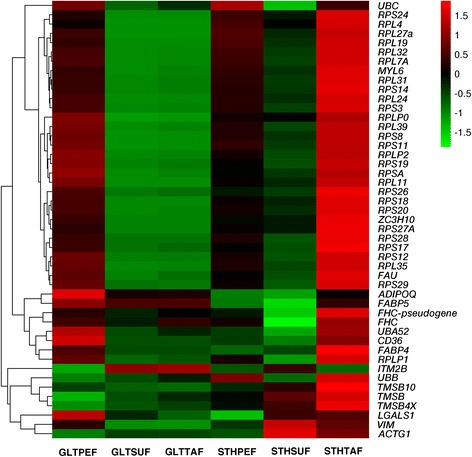
A heat-map showing the top 47 highly expressed co-genes. The cluster analysis of gene expression is based on log2 RPKM data. The red color represents higher expression and the green color represents lower expression

A heat-map showing the top 47 highly expressed co-genes. The cluster analysis of gene expression is based on log2 RPKM data. The red color represents higher expression and the green color represents lower expression