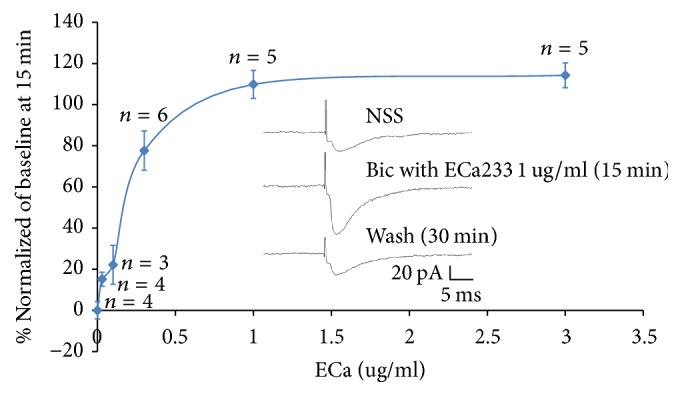
Figure 6.

Concentration-response curve for the enhancement of EPSCs of ITC by ECa233. The EPSCs in the presence of ECa233 and bicuculline were normalized with respect to the control condition and were averaged (each point was the mean ± SEM of 5–8 neurons). Tracing showed before and after 15 min application of ECa233 and 30 minutes PBS washes the effect of ECa233.
