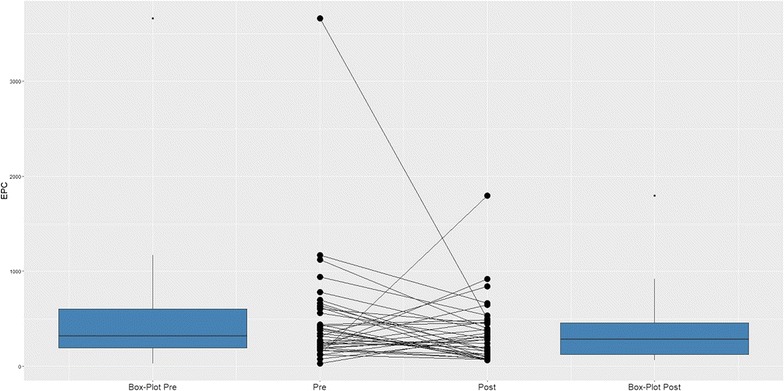
Fig. 1.

Changes in EPC counts before and after PCI. The boxplot on the left represents EPC counts before PCI with the median EPC count before PCI (320 cell/mcl). The boxplot on the right represents EPC counts after PCI with the median EPC count after PCI (286 cells/mcl). The middle graph shows the EPC behaviours for each patient
