Figure 2.

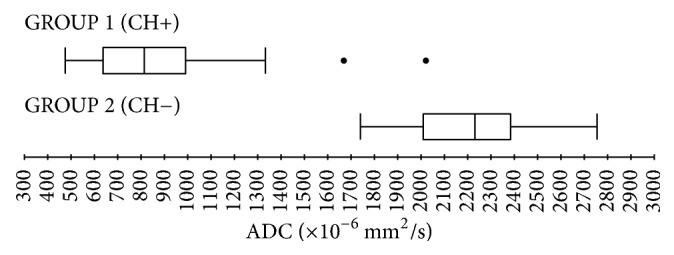
Boxplots representing ADC values distribution in group 1 (patients with histologically confirmed cholesteatoma) and group 2 (histologically identified noncholesteatomatous inflammatory lesions).

Boxplots representing ADC values distribution in group 1 (patients with histologically confirmed cholesteatoma) and group 2 (histologically identified noncholesteatomatous inflammatory lesions).