
Fig. 4.
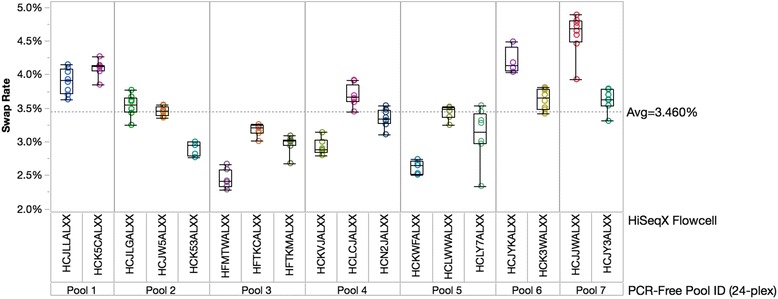
Variability of index swap rates from pool to pool and flow cell to flow cell. Index swapping rates plotted for seven 24-plex pools, each sequenced on at least two HiSeqX flow cells and prepared using identical automated methods on a Hamilton MiniStar. Each data point represents a flow cell lane. The data shows variability between different pools, but also variability for the same pools run on different flow cells, indicating that flow cell and/or ExAmp reagents also influence swap rate variability