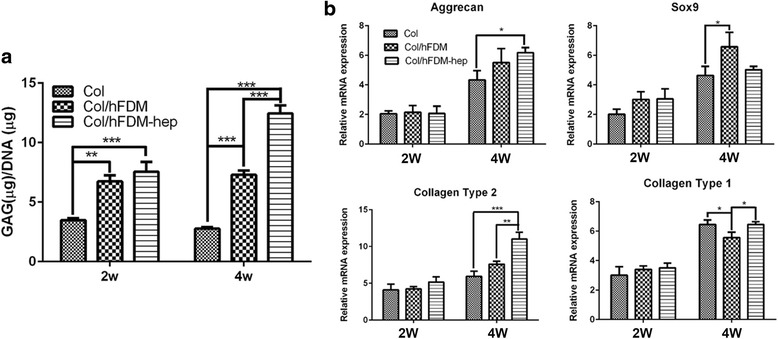
Fig. 4.

GAG contents and chondrogenic markers expression. a The GAG concentrations normalized to DNA content of each sample; b Chondrogenic gene expression of positive markers (aggrecan, Sox9, collagen type2) and negative marker (collagen type1) after 2 and 4 weeks of culture in chondrogenic medium. (*p < 0.05, ** p < 0.01, ***p < 0.001)
