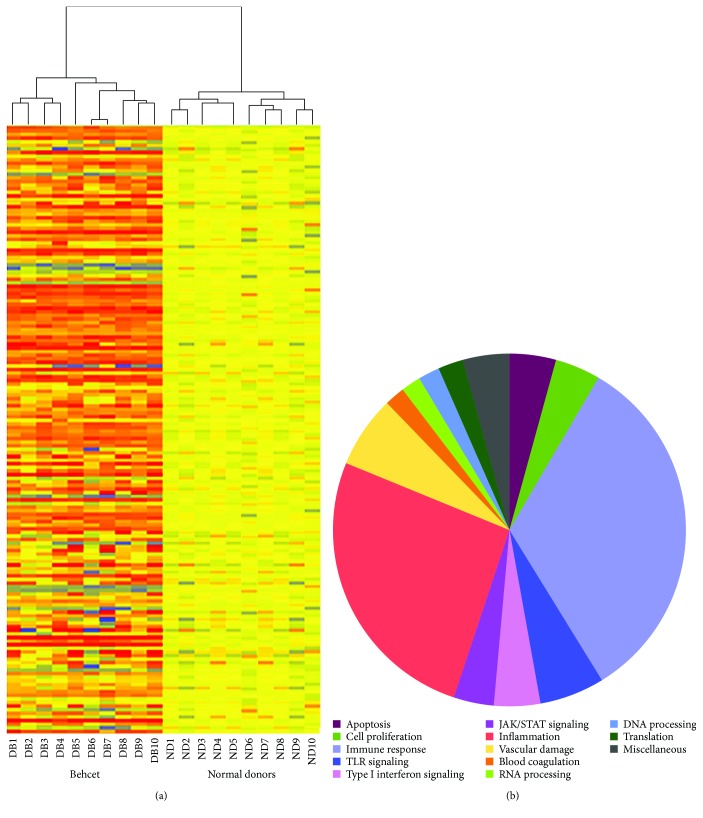
Figure 1.
Modulated genes in PBCs of 10 BD patients and their functional classification. Heat map of significantly modulated genes (a). Each row represents a gene, each column shows the expression of selected genes in each individual sample. Blue-violet indicates genes that are expressed at lower levels when compared with the mean value of the control subjects, orange-red indicates genes that are expressed at higher levels when compared to the control means, and yellow indicates genes whose expression levels are similar to the control mean. Panel (b) shows the functional categorization of BD modulated genes according to GO terms. In the legend, the gene classes are listed in a clock-wise order starting at the “12 o'clock” position.

