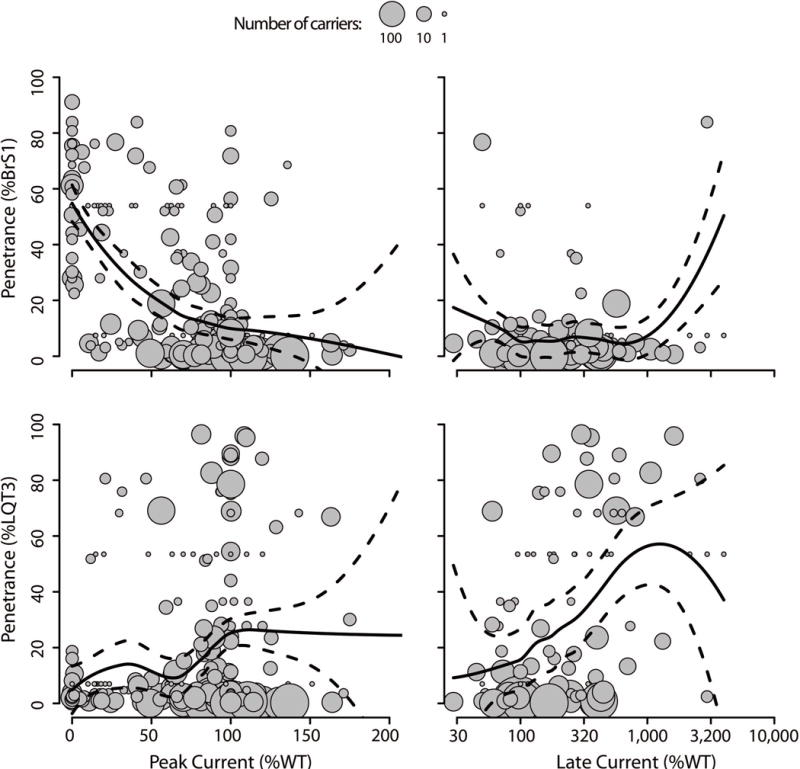
Figure 4.

Degree of perturbation in peak current and late current versus BrS1 or LQT penetrance. Each grey circle is an SCN5A variant where the radius is equal to log10(number of carriers). The solid trend line is the locally weighted average of penetrance from functional perturbation; the dashed lines are 95% confidence intervals for the weighted average. Median absolute error for BrS1 penetrance by peak current and late current are 14 and 10%, respectively; Median absolute error for LQT3 penetrance by peak current and late current are 14 and 32%, respectively.”
