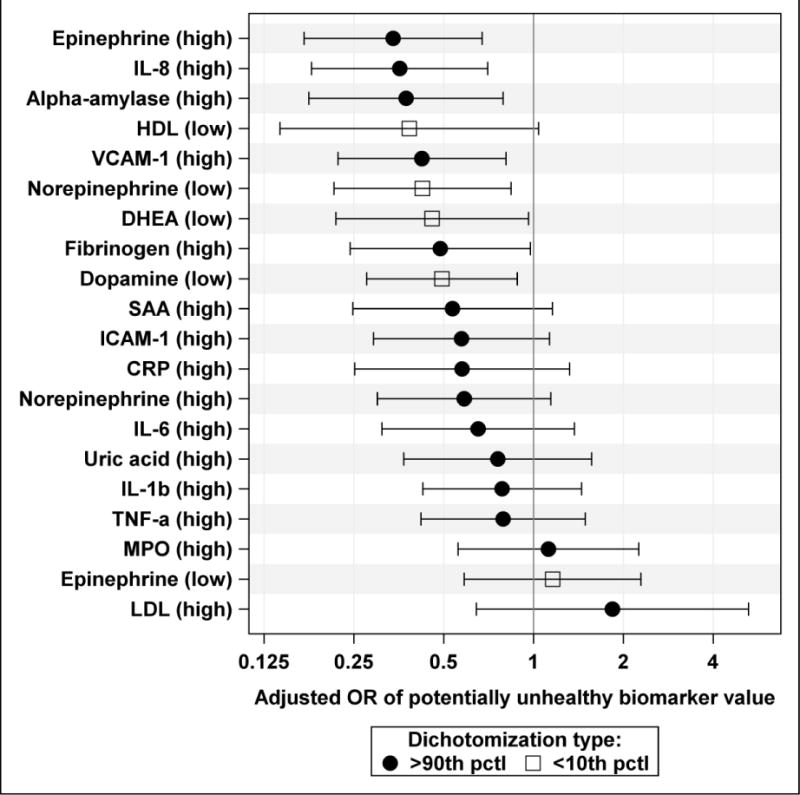
Fig. 1.

Adjusted ORs of potentially unhealthy biomarker values with 95% confidence limits per IQR increase in residential vegetated land cover (weighting scheme 5 based on exponential decay with λ = 0.0025), plotted on a logarithmic scale. Biomarkers dichotomized at 10th percentile (< 10 pctl) or 90th percentile (> 90 pctl) of their distributions.
