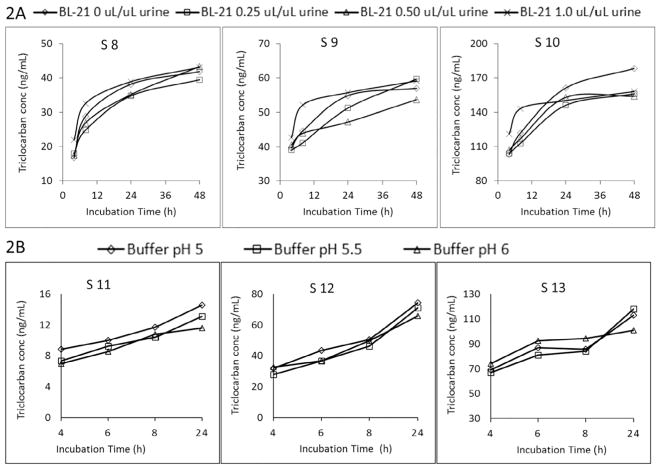
Fig. 2.
Fig. 2A, Total triclocarban concentrations for urine samples S8–S10 after incubating with enzyme mixture solution (BL-21 + 5 units H-1/μL urine) at 37 °C and different amounts of BL-21 (0, 0.25, 0.50, 1.0 μL per μL urine). Fig. 2B, Total triclocarban concentrations for urine samples S11–S13 after incubating with enzyme mixture solution (1.0 μL BL-21/μL urine + 5 units H-1/μL urine) prepared with buffers at different pH values.

