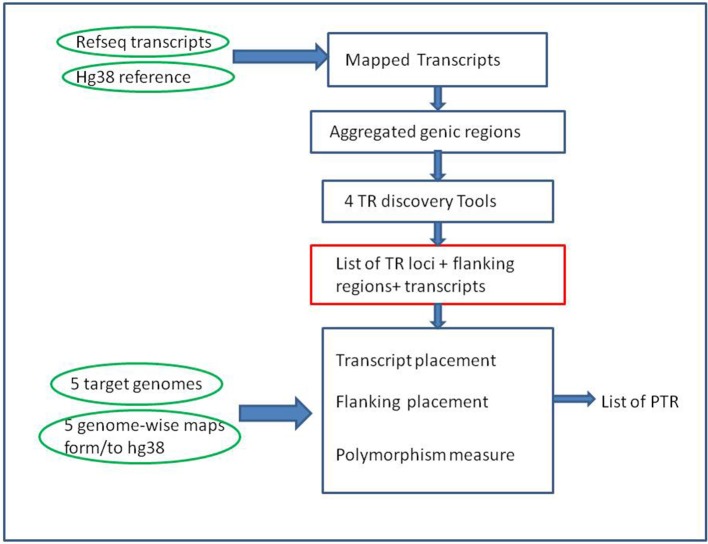
Figure 1.
Overall computational pipeline. Green ovals represent the main input data sets, Blue rectangles computational steps, and the red rectangle a key intermediate result. Note that the TR discovery tools are applied only to the reference genome (GRCh38) in the initial part of the pipeline. The target genomes are used in the second part of the pipeline, as input for alignment-based procedures, to measure polymorphism of the candidate TR loci.

