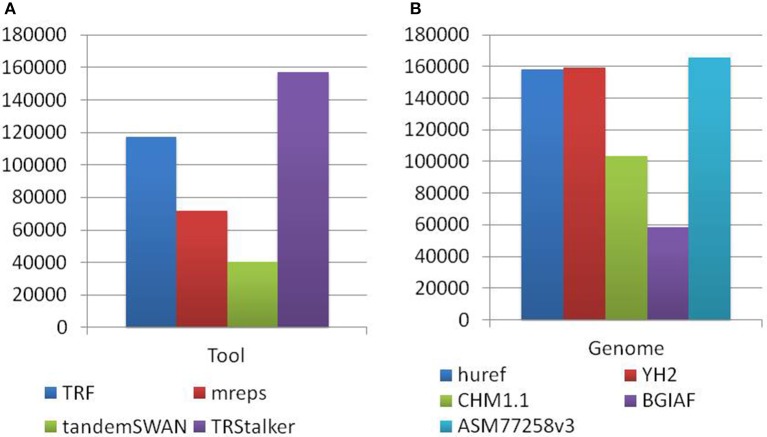
Figure 4.
Distribution of PTR in the census relative to the computational pipeline. In the discovery pipeline the initial part of the pipeline produces a list of candidate TR by using four TR discovery tools. In the second part these candidates are classified as polymorphic (thus included in the output PTR listing) or not polymorphic by using five target genomes. (A) Numbers obtained by tracing back each PTR locus to the tool (o tools) that discovered the associated TR candidate. (B) Numbers obtained by tracing back each PTR locus to the target genome (or genomes) giving evidence that led to to classifying it as polymorphic. Note that each PTR may be counted in more than one column of subfigures (A,B).

