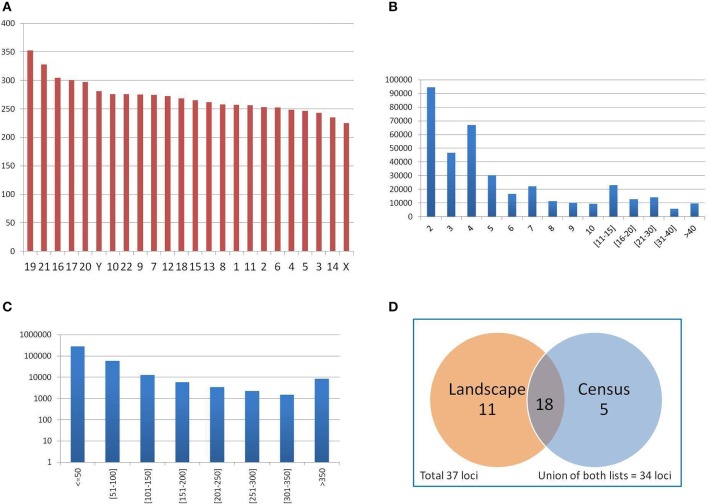
Figure 6.
(A) Average number of PTR per Mbp of genic regions (merging of gene transcripts) in each chromosome. Autosomal chromosomes are numbered from 1 to 22, sexual chromosomes X and Y. Chromosomes are sorted in decreasing PTR density values. (B) Distribution of PTR per number of repeating units (in the reference genome). (C) Distribution of PTR per total size of the PTR loci (in the reference genome), in logarithmic scale. (D) Classification of 37 clinically relevant loci as PTR in the census and landscape catalogs.

