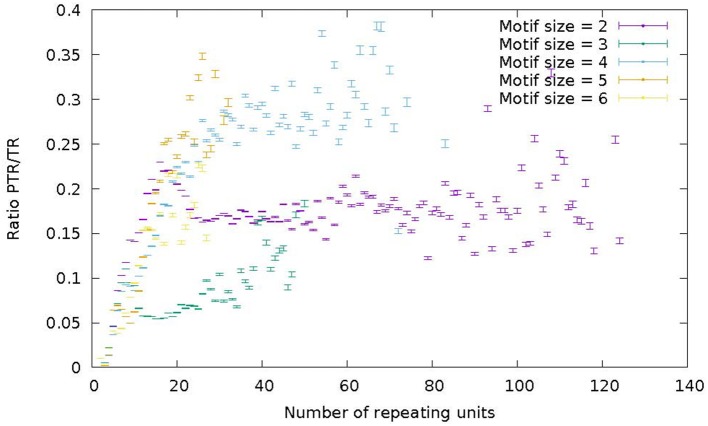
Figure 7.
Ratio of the number of PTR over the number of candidate TR (PTR/TR ratio), subdivided in classes characterized by the size of the motif in the range 2–6 (color) and by the number of repeating units in the reference genome (abscisa). For each point in the graph the corresponding 95% Confidence Interval (CI) is given as a vertical bar.

