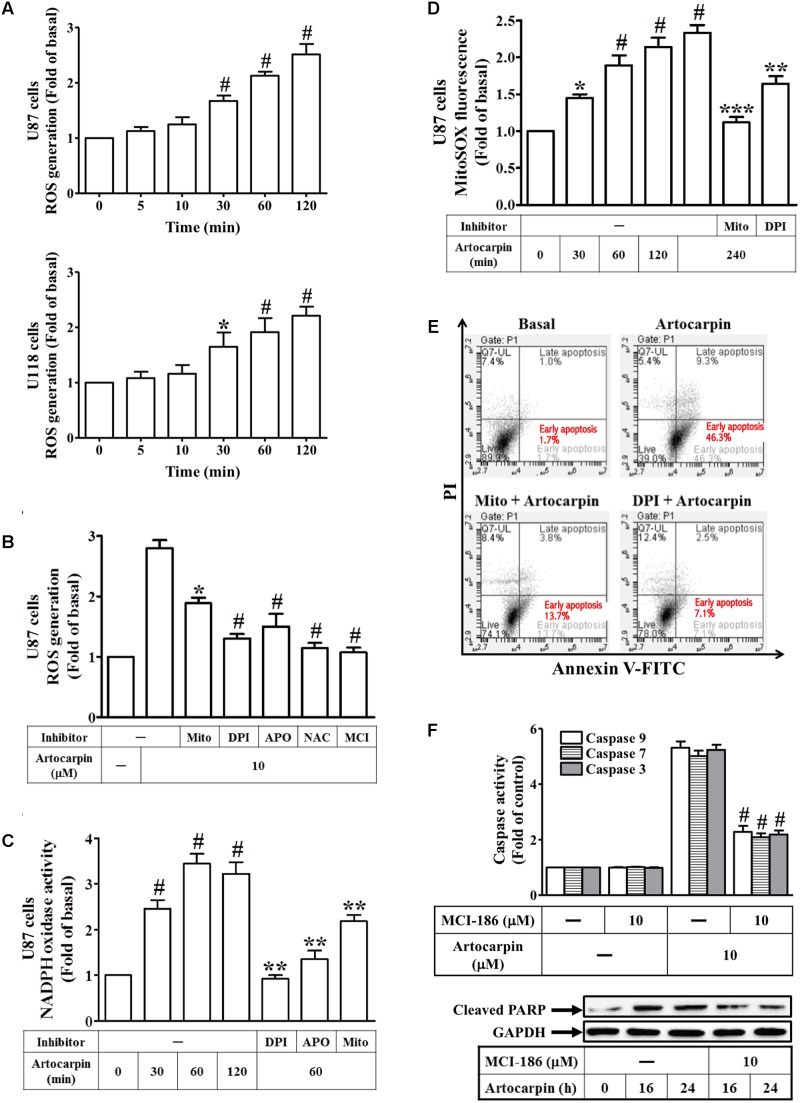
FIGURE 2.
Artocarpin-induced apoptosis in U87- or U118 cells is mediated by ROS generation. (A) Cells were treated with artocarpin (10 μM) for the indicated times. ROS generation was measured with CellROX reagent. (B) Cells were pretreated with MitoTEMPOL (10 μM), DPI (1 μM), APO (100 μM), NAC (5 mM), or MCI-186 (10 μM) for 1 h then incubated with artocarpin for 2 h. ROS generation was measured with CellROX reagent. (C) Cells were either not pretreated or pretreated with DPI (1 μM), APO (100 μM), or MitoTEMPOL (10 μM) for 1 h then incubated with artocarpin for the indicated times. NADPH oxidase activity was measured. (D) Cells were either not pretreated or pretreated with MitoTEMPOL (10 μM) or DPI (1 μM) for 1 h then incubated with artocarpin for the indicated times. MitoSOX fluorescence was measured with a fluorescence plate reader. (E) Cells were pretreated with MitoTEMPOL (10 μM) or DPI (1 μM) for 1 h then incubated with artocarpin for 24 h. U87 cell apoptosis was evaluated by flow cytometry. U87 cells were labeled with annexin V-FITC and PI. Flow cytometry profile shows annexin-V-FITC staining in the x-axis and PI in the y-axis. (F) Cells were pretreated with MCI-186 (10 μM) for 1 h then incubated with artocarpin for 24 h. Caspase activity was determined with caspase-3, -7, and -9 colorimetric assay kits. Cells were also pretreated with MCI-186 (10 μM) for 1 h then incubated with artocarpin for the indicated times. Cleaved PARP protein expression was determined by western blot. Data are expressed as means ± SE of three independent experiments. #P < 0.01 compared with cells exposed to vehicle (A,C,D). ∗P < 0.05, #P < 0.01 compared with cells exposed to artocarpin alone (B,F). ∗∗P < 0.01 compared with cells exposed to artocarpin alone (C,D). ∗∗∗P < 0.001.

