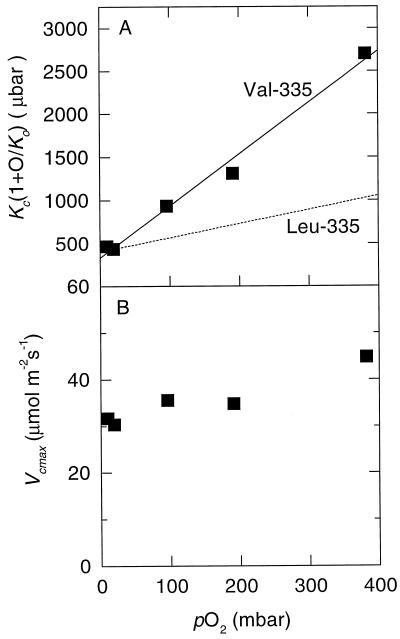
Figure 7.
The responses of the apparent Km for CO2 (A) and the maximal carboxylation rate (Vcmax) (B) of the Val-335 Rubisco to pO2 inferred from gas-exchange data. The data were calculated from CO2-response curves similar to those in Figure 6A measured at different pO2 as described by von Caemmerer et al. (1994). An infinite conductance for CO2 transfer between the intercellular air spaces and the sites of carboxylation was assumed. The solid line in A is a linear fit to the data for one transformant plant (▪). For comparison, the dashed line shows the in vivo response of the wild-type Rubisco (Leu-335) calculated from the data of von Caemmerer et al. (1994) for Rubisco-deficient anti-rbcS tobacco.

