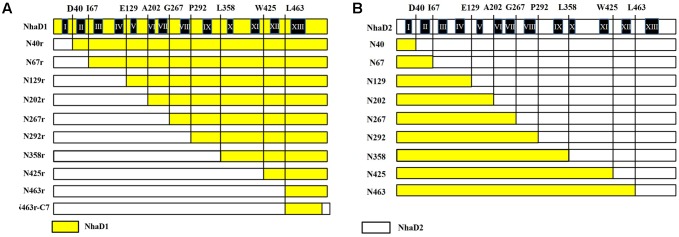
FIGURE 1.
Schematic representation of NhaD1 and NhaD2 chimeras. (A) NhaD1 chimeras that replaced N-terminal regions of NhaD1 with corresponding regions of NhaD2. (B) NhaD2 chimeras that replaced N-terminal regions of NhaD2 with corresponding regions of NhaD1. Regions from NhaD1 and NhaD2 are colored with yellow and white, respectively.

