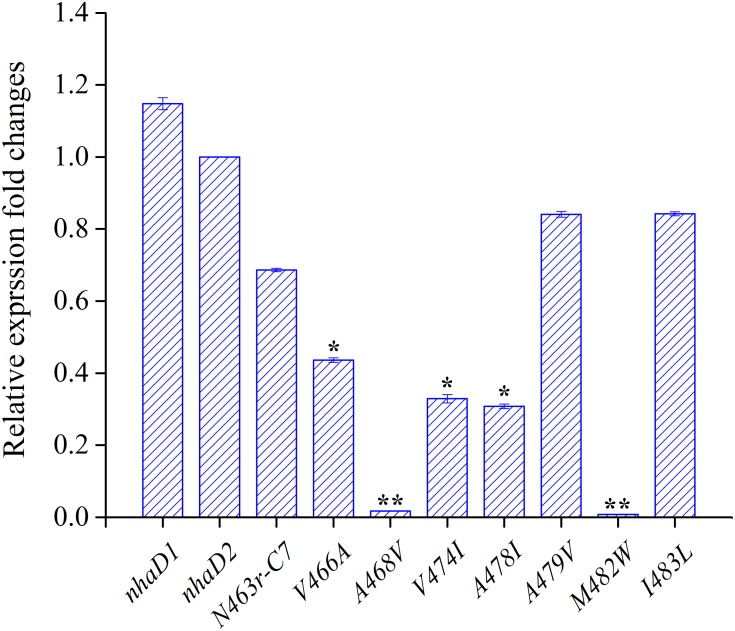
FIGURE 7.
Transcript levels of N463r-C7 mutants determined by qPCR analysis. The relative expression levels for each gene were calculated using the by 2-ΔΔCt with normalization to 16S rRNA genes. The significant differences (∗∗P < 0.001, ∗P < 0.05, fold change ≥2 or fold change ≤0.5, Student’s t-test) between the expression levels of mutated genes and nhaD2 are indicated by asterisks.

