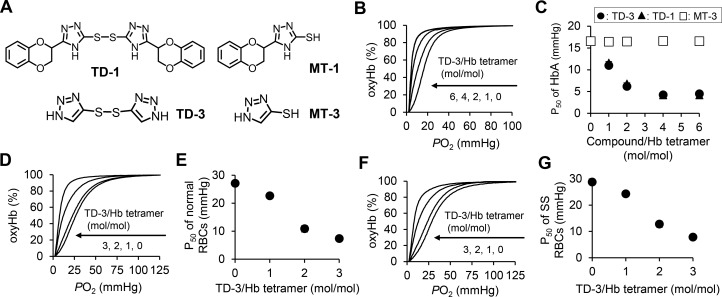
Figure 1.
(A) Structure of triazole disulfides (TD-1 and TD-3) and mercaptotriazoles (MT-1 and MT-3). (B) Left-shift of the oxygen dissociation curve (ODC) of purified HbA with increasing molar ratio of TD-3:Hb tetramer. The ODC for TD-3:Hb tetramer molar ratio of 6:1 overlaps with that of the molar ratio of 4:1. (C) The dose-dependent effect of TD-3 on the P50 of HbA. The plots of TD-3 (circle) overlap with the plots of TD-1 (triangle). (D) Left-shift of the ODC of normal human blood with increasing molar ratio of TD-3 to Hb tetramer. (E) The dose-dependent effect of TD-3 on reducing the P50 of normal RBCs. (F) Left-shift of the ODC of SS RBCs with increasing molar ratio of TD-3:Hb tetramer. (G) The dose-dependent effect of TD-3 on reducing the P50 of SS RBCs. The ODCs were measured in triplicate at 37 °C. Each data point in panel C, E, and G represents the mean value of the P50 determined from the ODCs. Error bars represent standard deviation (sd). Most error bars are too short to visualize because the sd was less than 1.2 mmHg.

