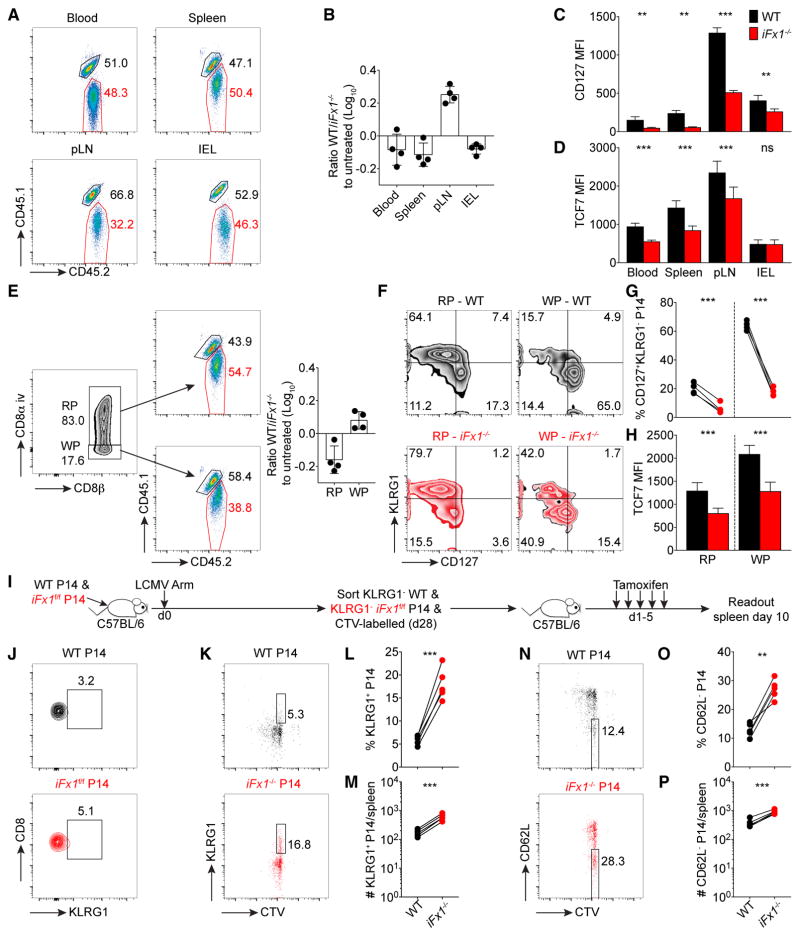
Figure 3. Acute Foxo1 Deletion in a Quiescent Memory T Cell Population Primarily Impacts TCM Subset.
C57BL/6 mice were co-injected with similar numbers (1.5 × 10⁴) of WT- and iFx1f/f-P14 and infected with LCMV Arm.
(A–H) 4 weeks post-infection, mice were treated with tamoxifen and 5 days after the last treatment (day 34 post infection) sacrificed and analyzed. (A) Representative flow cytometry gated on total P14 in TAM-treated mice showing WT- (CD45.1+CD45.2+) and iFx1−/−-P14 (CD45.2+) percentage in indicated organs.
(B) WT/iFx1−/−-P14 ratio compared to the ratio of untreated controls.
(C and D) CD127 (C) and TCF7 (D) expression among P14 cells from indicated organs.
(E) Representative flow cytometry of intravascular staining pattern distinguishing between P14 in red pulp (RP; CD8α+) and white pulp (WP; CD8α−), and the WT (CD45.1+CD45.2+) and iFx1−/−-P14 (CD45.2+) percentage within the RP (top) and WP (bottom). Calculated WT/iFx1−/−-P14 ratio in the RP and WP compared to untreated controls (right).
(F and G) Expression of KLRG1 and CD127 of WT- and iFx1−/−-P14 in the red pulp (RP; CD8α+) and white pulp (WP; CD8α−), and the percentage of CD127+KLRG1− P14 for all mice (G).
(H) TCF7 expression levels of WT- and iFx1−/−-P14 in the red pulp (RP; CD8α+) and white pulp (WP; CD8α−).
(I) Experimental design used in (J)–(P). C57BL/6 mice grafted with similar numbers (5 × 10⁴) of WT- and iFx1f/f-P14 cells were infected with LCMV Arm. 4 weeks post-infection, KLRG1− WT- and KLRG1− iFx1f/f-P14 were FACS purified from spleen and lymph nodes, labeled with CellTrace violet (CTV), and co-transferred into naive C57BL/6 hosts, which were 1 day later treated with TAM.
(J) Purification control of transferred KLRG1− WT- and KLRG1− iFx1f/f-P14.
(K–P) Splenocytes were stained for expression of KLRG1 and CD62L. (K–M) Representative FACS plots illustrating the fraction of undivided KLRG1-expressing KLRG1− WT- and KLRG1− iFx1−/−-P14 (K) as well as the calculated fraction (L) and absolute numbers (M) for all mice. (N–P) Fraction (N and O) and absolute numbers (P) of undivided CD62L− WT- and CD62L− iFx1−/−-P14.
Data are representative of at least two experiments with at least four mice per treated group. Error bars in (B) and (D) indicate SD. Statistical analysis was by paired Student’s t test. ***p < 0.001; **p < 0.01; ns, not significant.

