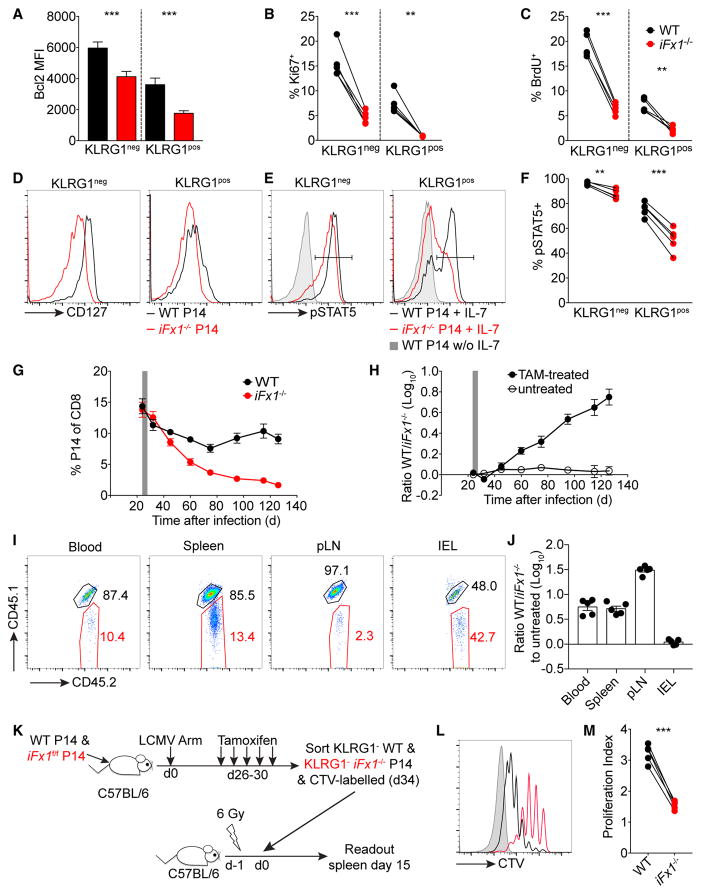
Figure 4. Foxo1 Deletion Impairs Memory Homeostasis.
C57BL/6 mice were grafted with similar numbers (4 × 10³–104) of WT- and iFx1f/f-P14 prior to infection with LCMV Arm. Mice were treated from days 27 to 31 with tamoxifen (TAM).
(A–F) Mice were administered BrdU for 6 days (days 36–42) (A–C) and spleens analyzed (day 42 post-LCMV Arm). BCL2 expression levels among KLRG1+/− WT-and iFx1−/−-P14 (A). Fraction of KI67+ (B) and BrdU+ (C) KLRG1+/− WT- and iFx1−/−-P14. CD127 expression among KLRG1+/− WT- and iFx1−/−-P14 (D). Representative histogram of STAT5 phosphorylation (E) following IL-7 stimulation of KLRG1+/− WT- and iFx1−/−-P14 compared to unstimulated KLRG1+/− WT-P14, which were representative of unstimulated KLRG1+/− iFx1−/−-P14 (data not shown). Percentage of pSTAT5+ among KLRG1+/− WT- and iFx1−/−-P14 (F).
(G) P14 kinetics following TAM treatment in the blood of the primary host.
(H) Ratio of WT to iFx1−/−-P14 over time in the blood compared to untreated controls.
(I and J) 100 days post-TAM treatment (day 130 post-LCMV Arm), mice were sacrificed and the ratio of WT- to iFx1−/−-P14 in different organs determined. Representative flow cytometry gated on total P14 showing WT- (CD45.1+CD45.2+) and iFx1−/−-P14 (CD45.2+) percentage (I) and WT/iFx1−/−-P14 ratio compared to untreated controls (J) in indicated organs 130 days post-infection.
(K) Experimental design used in (L) and (M): C57BL/6 mice grafted with similar numbers (5 × 10⁴) of WT- and iFx1f/f-P14 were infected with LCMV Arm and treated with TAM 4 weeks post-infection. 5 days later, KLRG1− WT- and KLRG1− iFx1−/−-P14 were FACS purified from spleen, labeled with CTV, and co-transferred into sublethally irradiated naive C57BL/6 hosts.
(L) Lymphopenia-induced proliferation of transferred KLRG1− WT- (black) and KLRG1− iFx1−/−-P14 (red) 15 days post-transfer in the spleen. Host cells (gray shadow) served as CTV− controls.
(M) Calculated proliferation index of transferred P14.
Error bars in (A), (G), (H), and (J) indicate SD. Symbols in (B), (C), (F), and (M) represent individual mice and in (G) and (H) the mean of four mice per treated group and at least two untreated mice; horizontal lines indicate the mean. Data are representative of at least two experiments, with at least four mice per treated group. Statistical analysis was by paired Student’s t test. ***p < 0.001; **p < 0.01; *p < 0.05; ns, not significant.

