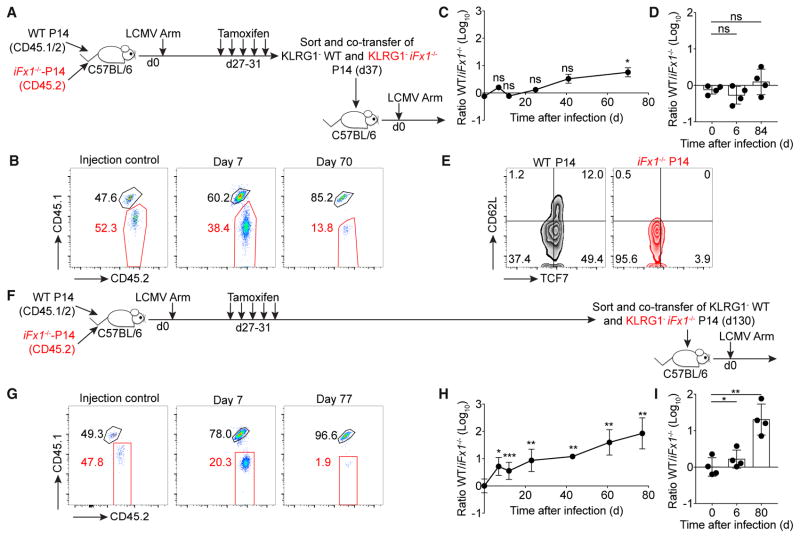
Figure 5. T Cells Originating from FOXO1 Null Memory Cells Display Impaired Re-expansion Capacity.
(A and F) C57BL/6 mice grafted with similar numbers (2 × 10⁴) of WT- and iFx1f/f-P14 were infected with LCMV Arm. 4 weeks post-infection, mice were treated with TAM. 5 days (A–E) or 100 days (F–I) post-TAM treatment, KLRG1− WT- and KLRG1− iFx1−/−-P14 splenocytes were individually FACS purified and co-transferred (A, 1.6–3.3 × 10³ P14; F, 1.5–5.5 × 10³ P14) into naive secondary C57BL/6 hosts followed by an LCMV Arm infection.
(B and G) Representative flow cytometry gated on P14 showing frequency of WT- (CD45.1+CD45.2+) and iFx1−/−-P14 (CD45.2+) transferred (injection control) and on day 7 (middle) and 70–77 (right) post-infection in the blood and calculated ratio for all mice (C and H).
(D and I) WT/iFx1−/− ratio in the spleen on days 6 and 80–84 compared to ratio of injection control (day 0).
(E) TCF7 and CD62L expression on WT- and iFx1−/−-P14 obtained from the spleen 84 days post-infection.
Symbols in (C) and (G) represent the mean of four mice. Symbols in (D) and (I) represent individual mice. Error bars in (C), (D), (H), and (I) indicate SD. Data are representative of at least two experiments with four mice per group. Statistical analysis was by paired Student’s t test. ***p < 0.001; **p < 0.01; *p < 0.05; ns, not significant.

