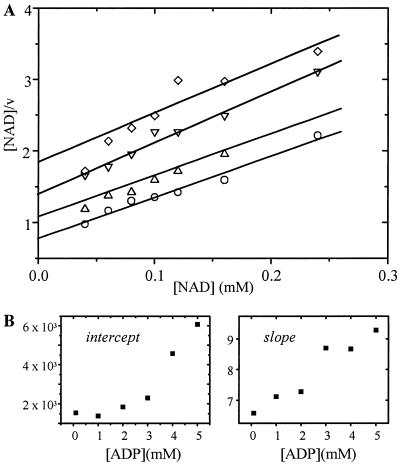
Figure 6.
Inhibition of SSADH1 by ADP determined by Hanes-plot (A) and secondary plots (B). The concentration of NAD+ varied between 0.01 and 0.3 mm, while the ADP concentration was held constant at the following values: 1 mm ADP (○); 2 mm ADP (▵); 3 mm ADP (▿); 4 mm ADP (⋄). The SSA concentration was 100 μm.

