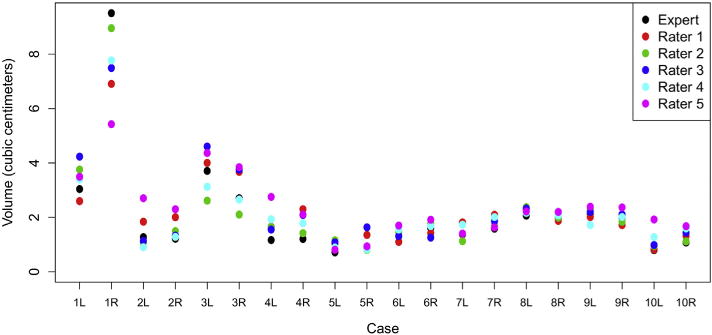
Figure 3.

Plotted distribution of the left and right neurovascular bundle volumes (in cubic centimeters) for each rater and the expert across all cases. The volume (in cubic centimeters) for the left (L) and right (R) neurovascular bundle for each case for each rater, 1-5, and the expert was determined. These values were plotted for each case to further detail the spread of the contoured volumes as well as the variation in volume of the neurovascular bundle volume for each case.
