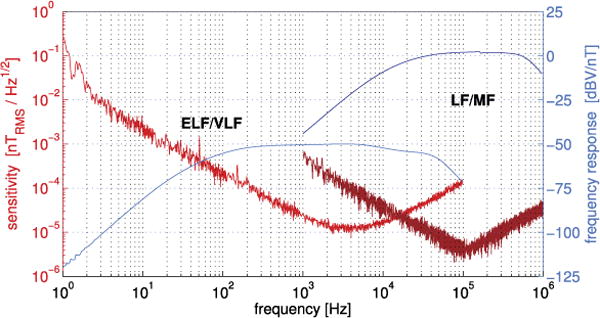
Fig. 12.

Measured sensitivity (in red) and frequency response (in blue) of SCM. The curves on the left are for the ELV/VLF antenna and the curves on the right for the LF/MF one. The highest measurable levels are 3000 nT in the ELF/VLF range, and 100 nT in the LF/MF range
