
Figure 2.
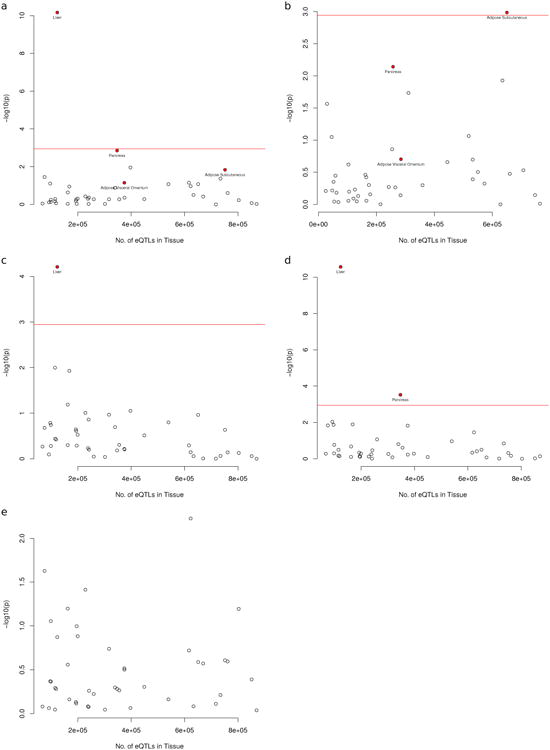
Tissue specific expression quantitative trait locus (eQTL) analysis in the 44 GTEx tissues. An upper-tailed p-value for enrichment of the count was calculated with a Z-score using the overall median tissue proportion and the standard deviation of the null distribution of that tissue. Tissues with P<0.05 are labeled, and the red line indicates the P-value threshold for Bonferroni significance. (A) All SNPs (N=284). (B) All SNPs removing liver eQTLs and rerunning the analysis in 43 GTEx tissues. (C) Exclusive HDL SNPs only (N=63). (D) Exclusive LDL SNPs only (N=61). (E) Exclusive TG SNPs only (N=39). All tests are two-sided.