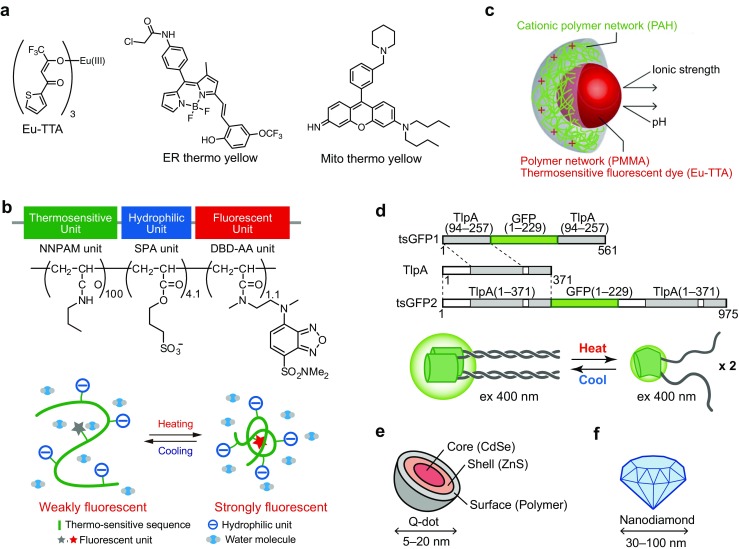
Fig. 2.

Schematic representation of fluorescent thermosensors for live single or subcellular cell thermometry. a Chemical structures of Eu-TTA, ER thermo yellow and Mito thermo yellow. b Schematic drawing of FPT. Upper; chemical structure of FPT. NNPAM, poly-N-n-propylacrylamide. SPA, 3-sulfopropyl acrylate. DBA-AA, N-{2-[(7-N,N-dimethylaminosulfonyl)-2,1,3-benzoxadiazol-4-yl](methyl)amino}ethyl-N-methylacrylamide. Lower; functional diagram of FPT in an aqueous medium. This figure is reproduced from Fig. 1 in [52]. c Schematic drawing of dye-embedded synthetic polymer nanothermometer. This figure is reproduced from Fig. 1 in [53] with permission. Copyright 2012, the Royal Society of Chemistry. d Schematic drawing of tsGFP. Upper; Design of tsGFPs. The gray bar indicates coiled-coil regions of TlpA. Lower; a schematic representation of the tandem formation of coiled-coil structure and temperature dependent fluorescence changes of tsGFP. This figure is reproduced from Fig. 1 in [35]. e, f Schematic drawing of quantum dots in e and fluorescent nanodiamonds in f
