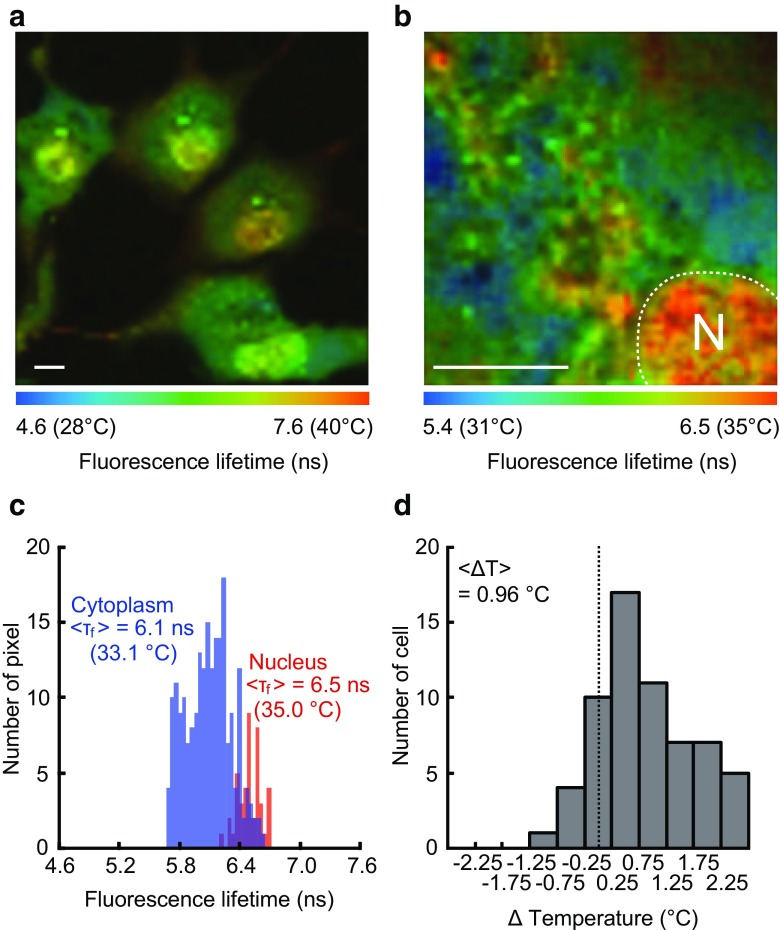
Fig. 4.
The higher temperature in the nucleus of COS7 cells observed with FPT. a Fluorescence lifetime image of FPT. Scale bar indicates 10 μm. b The temperature distribution in the local area of cell. N represents the location of the nucleus. Scale bar indicates 10 μm. c Higher temperature in the nucleus. Histograms of the fluorescence lifetime in the nucleus and in the cytoplasm in a representative cell (the leftmost cell in a). d Histogram of the temperature difference between the nucleus and the cytoplasm (n = 62 cells). ΔTemperature was calculated by subtracting the average temperature of the cytoplasm from that of the nucleus. <ΔT> represents an average of the histogram. This figure is reproduced from Figures 4 and 6 in [52]

