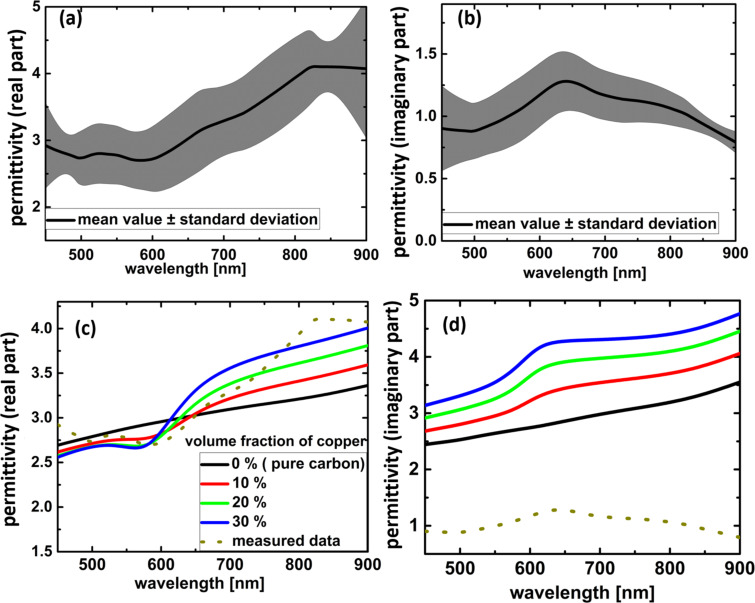
Figure 3.
(a) Real and (b) imaginary part of the dielectric function of the measured FEBID material, averaged over 5 pads together with the standard deviation. (c) Real and (d) imaginary part of the Maxwell–Garnett model. The model uses the dielectric function of copper from [24], and of carbon from [23]. The dotted lines are the measured values.

