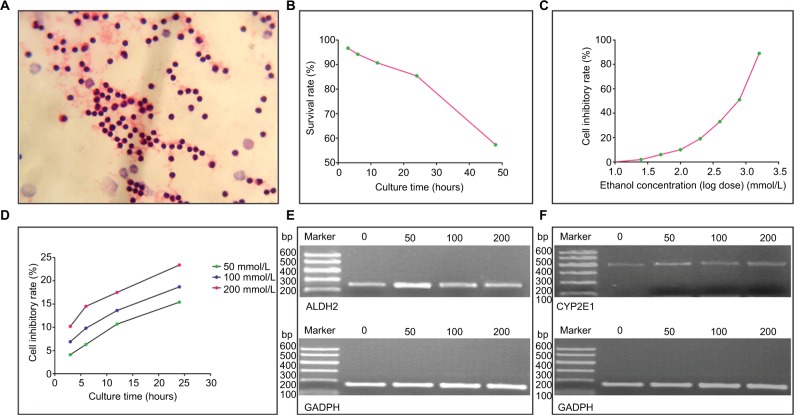
Figure 1.
Lymphocytes and ALDH2/CYP2E1 mRNA expression profiles. (A) Lymphocytes stained by the H&E method. (B) Curve of lymphocyte survival rate–culture time. (C) Curve of lymphocyte inhibitory rate–ethanol concentration. (D) Curves of lymphocyte inhibitory rate–culture time at different ethanol concentrations. (E and F) ALDH2, CYP2E1, and GAPDH mRNA expression levels at different ethanol concentrations.

