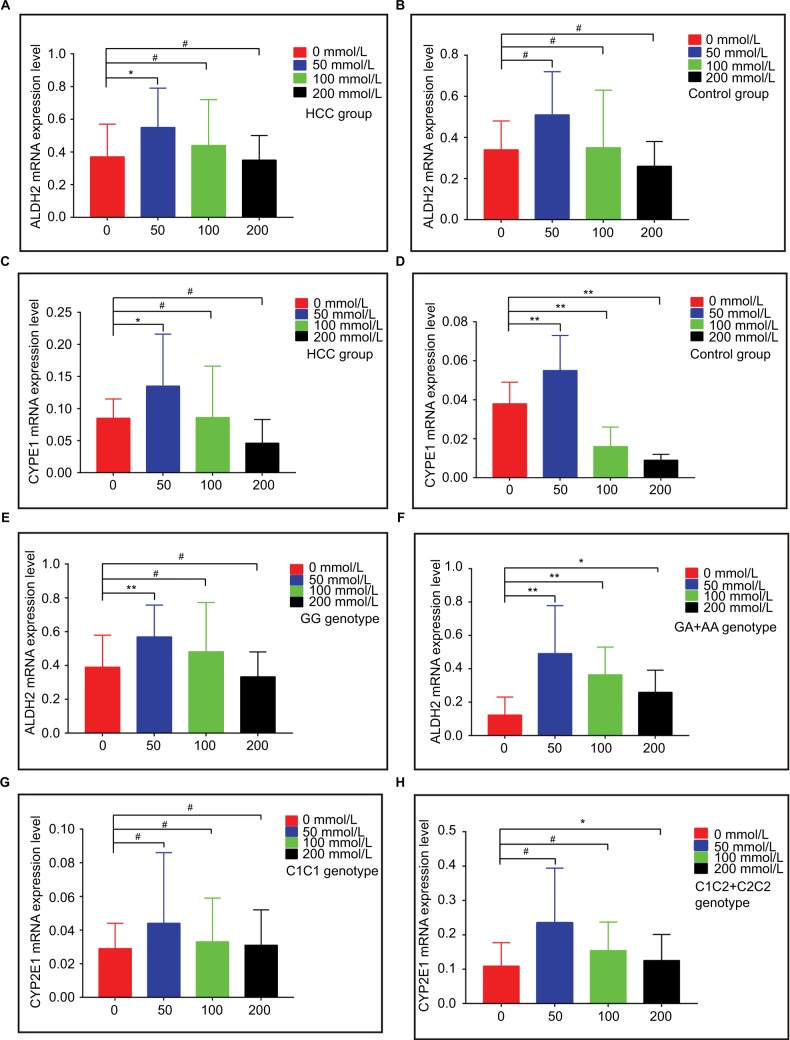
Figure 2.
mRNA expression levels of ALDH2 and CYP2E1 in different groups. (A and B) ALDH2 mRNA expression levels in HCC and control groups. (C and D) CYP2E1 mRNA expression levels in HCC and control groups. (E and F) ALDH2 mRNA expression levels of the GG and GA+AA genotypes. (G and H) CYP2E1 mRNA expression levels of the C1/C1 and C1/C2+C2/C2 genotypes.
Note: * P<0.05; ** P<0.01; # P>0.05.
Abbreviation: HCC, hepatocellular carcinoma.

