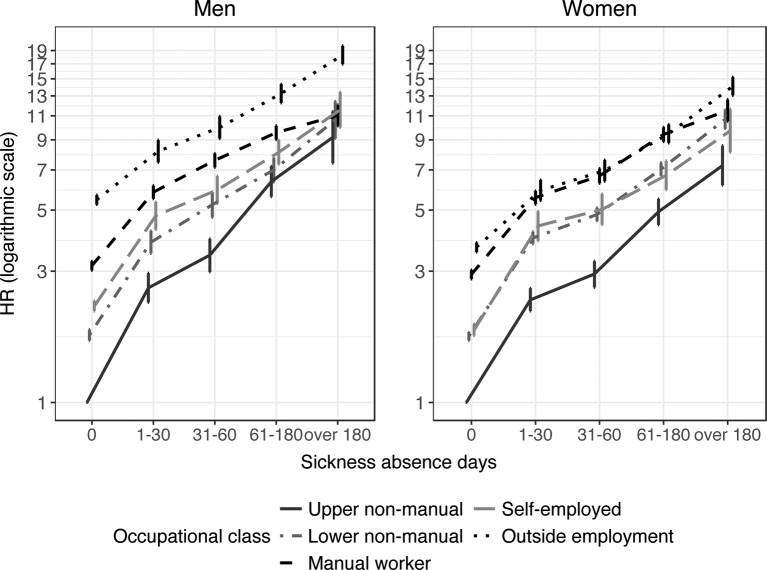
Figure 1.
HRs for the risk of all-cause disability retirement in 2007–2014 with their 95% CIs according to the length of all-cause SA in different occupational classes in men and women. Upper non-manual workers with no sickness allowance days is the reference group. HRs on the logarithmic scale. All adjusted for all sociodemographic variables. SA, sickness absence.

