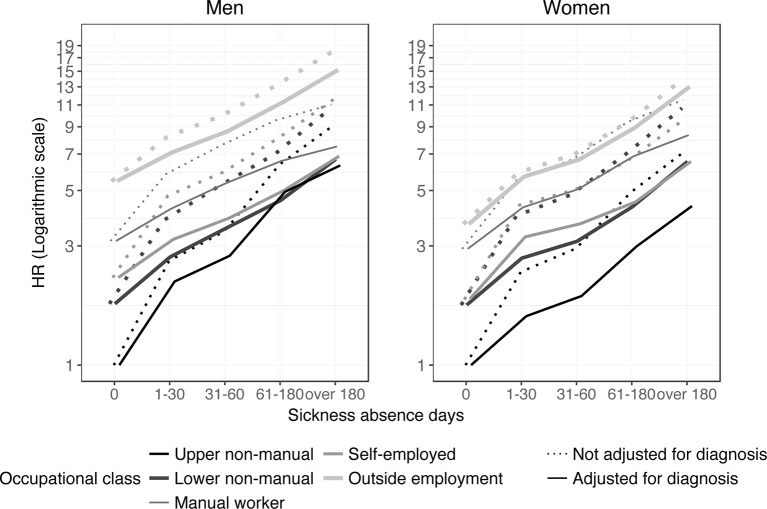
Figure 3.
HRs for the risk of all-cause disability retirement in 2007–2014 according to the length of SA in different occupational classes in men and women. Upper non-manual workers with no sickness allowance days is the reference group. HRs on the logarithmic scale. All adjusted for all sociodemographic variables. Dotted lines represent HRs when not adjusted for diagnoses and solid lines represent HRs after adjusting for the diagnoses. SA, sickness absence.

